Note
Go to the end to download the full example code
Construct Spremberg: Importing borehole data
This example demonstrates how to construct a 3D geological model of the Model 1 deposit using GemPy. It leverages custom APIs to streamline the modeling process.
Import the necessary libraries for geological modeling and visualization. sphinx_gallery_thumbnail_number = -1
import os
import pandas as pd
import pyvista

import gempy as gp
import gempy_viewer as gpv
from subsurface.core.geological_formats.boreholes.boreholes import BoreholeSet, MergeOptions
from subsurface.core.geological_formats.boreholes.collars import Collars
from subsurface.core.geological_formats.boreholes.survey import Survey
from subsurface.core.reader_helpers.readers_data import GenericReaderFilesHelper
from subsurface.modules.reader.wells.read_borehole_interface import read_lith, read_survey, read_collar
from subsurface.modules.visualization import to_pyvista_line, to_pyvista_points, init_plotter
A module that was compiled using NumPy 1.x cannot be run in
NumPy 2.1.1 as it may crash. To support both 1.x and 2.x
versions of NumPy, modules must be compiled with NumPy 2.0.
Some module may need to rebuild instead e.g. with 'pybind11>=2.12'.

If you are a user of the module, the easiest solution will be to
downgrade to 'numpy<2' or try to upgrade the affected module.
We expect that some modules will need time to support NumPy 2.

Traceback (most recent call last):  File "/home/leguark/.virtualenvs/gempy_dependencies/bin/sphinx-build", line 8, in <module>
    sys.exit(main())
  File "/home/leguark/.virtualenvs/gempy_dependencies/lib/python3.10/site-packages/sphinx/cmd/build.py", line 339, in main
    return make_main(argv)
  File "/home/leguark/.virtualenvs/gempy_dependencies/lib/python3.10/site-packages/sphinx/cmd/build.py", line 213, in make_main
    return make_mode.run_make_mode(argv[1:])
  File "/home/leguark/.virtualenvs/gempy_dependencies/lib/python3.10/site-packages/sphinx/cmd/make_mode.py", line 181, in run_make_mode
    return make.run_generic_build(args[0])
  File "/home/leguark/.virtualenvs/gempy_dependencies/lib/python3.10/site-packages/sphinx/cmd/make_mode.py", line 169, in run_generic_build
    return build_main(args + opts)
  File "/home/leguark/.virtualenvs/gempy_dependencies/lib/python3.10/site-packages/sphinx/cmd/build.py", line 293, in build_main
    app = Sphinx(args.sourcedir, args.confdir, args.outputdir,
  File "/home/leguark/.virtualenvs/gempy_dependencies/lib/python3.10/site-packages/sphinx/application.py", line 272, in __init__
    self._init_builder()
  File "/home/leguark/.virtualenvs/gempy_dependencies/lib/python3.10/site-packages/sphinx/application.py", line 343, in _init_builder
    self.events.emit('builder-inited')
  File "/home/leguark/.virtualenvs/gempy_dependencies/lib/python3.10/site-packages/sphinx/events.py", line 97, in emit
    results.append(listener.handler(self.app, *args))
  File "/home/leguark/.virtualenvs/gempy_dependencies/lib/python3.10/site-packages/sphinx_gallery/gen_gallery.py", line 632, in generate_gallery_rst
    ) = generate_dir_rst(src_dir, target_dir, gallery_conf, seen_backrefs)
  File "/home/leguark/.virtualenvs/gempy_dependencies/lib/python3.10/site-packages/sphinx_gallery/gen_rst.py", line 531, in generate_dir_rst
    intro, title, (t, mem) = generate_file_rst(
  File "/home/leguark/.virtualenvs/gempy_dependencies/lib/python3.10/site-packages/sphinx_gallery/gen_rst.py", line 1203, in generate_file_rst
    output_blocks, time_elapsed = execute_script(
  File "/home/leguark/.virtualenvs/gempy_dependencies/lib/python3.10/site-packages/sphinx_gallery/gen_rst.py", line 1108, in execute_script
    execute_code_block(
  File "/home/leguark/.virtualenvs/gempy_dependencies/lib/python3.10/site-packages/sphinx_gallery/gen_rst.py", line 970, in execute_code_block
    is_last_expr, mem_max = _exec_and_get_memory(
  File "/home/leguark/.virtualenvs/gempy_dependencies/lib/python3.10/site-packages/sphinx_gallery/gen_rst.py", line 818, in _exec_and_get_memory
    mem_max, _ = gallery_conf["call_memory"](
  File "/home/leguark/.virtualenvs/gempy_dependencies/lib/python3.10/site-packages/sphinx_gallery/gen_gallery.py", line 244, in call_memory
    return 0.0, func()
  File "/home/leguark/.virtualenvs/gempy_dependencies/lib/python3.10/site-packages/sphinx_gallery/gen_rst.py", line 722, in __call__
    exec(self.code, self.fake_main.__dict__)
  File "/home/leguark/vector-geology/examples/02_structural_modeling/03_model_spremberg_import.py", line 17, in <module>
    from subsurface.core.geological_formats.boreholes.boreholes import BoreholeSet, MergeOptions
  File "/home/leguark/subsurface/subsurface/__init__.py", line 1, in <module>
    import subsurface.modules.reader
  File "/home/leguark/subsurface/subsurface/modules/reader/__init__.py", line 5, in <module>
    from .topography.topo_core import read_structured_topography, read_unstructured_topography
  File "/home/leguark/subsurface/subsurface/modules/reader/topography/topo_core.py", line 5, in <module>
    from ....core.structs.structured_elements.structured_grid import StructuredGrid
  File "/home/leguark/subsurface/subsurface/core/__init__.py", line 1, in <module>
    from . import geological_formats
  File "/home/leguark/subsurface/subsurface/core/geological_formats/__init__.py", line 1, in <module>
    from .boreholes.boreholes import BoreholeSet, Collars, Survey
  File "/home/leguark/subsurface/subsurface/core/geological_formats/boreholes/boreholes.py", line 6, in <module>
    from ._combine_trajectories import create_combined_trajectory, MergeOptions
  File "/home/leguark/subsurface/subsurface/core/geological_formats/boreholes/_combine_trajectories.py", line 5, in <module>
    from .collars import Collars
  File "/home/leguark/subsurface/subsurface/core/geological_formats/boreholes/collars.py", line 4, in <module>
    from ...structs.base_structures import UnstructuredData
  File "/home/leguark/subsurface/subsurface/core/structs/__init__.py", line 1, in <module>
    from .base_structures import StructuredData, UnstructuredData
  File "/home/leguark/subsurface/subsurface/core/structs/base_structures/__init__.py", line 1, in <module>
    from .unstructured_data import UnstructuredData
  File "/home/leguark/subsurface/subsurface/core/structs/base_structures/unstructured_data.py", line 6, in <module>
    import xarray as xr
  File "/home/leguark/.virtualenvs/gempy_dependencies/lib/python3.10/site-packages/xarray/__init__.py", line 3, in <module>
    from xarray import groupers, testing, tutorial
  File "/home/leguark/.virtualenvs/gempy_dependencies/lib/python3.10/site-packages/xarray/groupers.py", line 17, in <module>
    from xarray.coding.cftime_offsets import BaseCFTimeOffset, _new_to_legacy_freq
  File "/home/leguark/.virtualenvs/gempy_dependencies/lib/python3.10/site-packages/xarray/coding/cftime_offsets.py", line 56, in <module>
    from xarray.coding.cftimeindex import CFTimeIndex, _parse_iso8601_with_reso
  File "/home/leguark/.virtualenvs/gempy_dependencies/lib/python3.10/site-packages/xarray/coding/cftimeindex.py", line 54, in <module>
    from xarray.coding.times import (
  File "/home/leguark/.virtualenvs/gempy_dependencies/lib/python3.10/site-packages/xarray/coding/times.py", line 14, in <module>
    from xarray.coding.variables import (
  File "/home/leguark/.virtualenvs/gempy_dependencies/lib/python3.10/site-packages/xarray/coding/variables.py", line 13, in <module>
    from xarray.core import dtypes, duck_array_ops, indexing
  File "/home/leguark/.virtualenvs/gempy_dependencies/lib/python3.10/site-packages/xarray/core/indexing.py", line 20, in <module>
    from xarray.core.types import T_Xarray
  File "/home/leguark/.virtualenvs/gempy_dependencies/lib/python3.10/site-packages/xarray/core/types.py", line 106, in <module>
    from cftime import datetime as CFTimeDatetime
  File "/home/leguark/.virtualenvs/gempy_dependencies/lib/python3.10/site-packages/cftime/__init__.py", line 1, in <module>
    from ._cftime import (datetime, real_datetime,

A module that was compiled using NumPy 1.x cannot be run in
NumPy 2.1.1 as it may crash. To support both 1.x and 2.x
versions of NumPy, modules must be compiled with NumPy 2.0.
Some module may need to rebuild instead e.g. with 'pybind11>=2.12'.

If you are a user of the module, the easiest solution will be to
downgrade to 'numpy<2' or try to upgrade the affected module.
We expect that some modules will need time to support NumPy 2.

Traceback (most recent call last):  File "/home/leguark/.virtualenvs/gempy_dependencies/bin/sphinx-build", line 8, in <module>
    sys.exit(main())
  File "/home/leguark/.virtualenvs/gempy_dependencies/lib/python3.10/site-packages/sphinx/cmd/build.py", line 339, in main
    return make_main(argv)
  File "/home/leguark/.virtualenvs/gempy_dependencies/lib/python3.10/site-packages/sphinx/cmd/build.py", line 213, in make_main
    return make_mode.run_make_mode(argv[1:])
  File "/home/leguark/.virtualenvs/gempy_dependencies/lib/python3.10/site-packages/sphinx/cmd/make_mode.py", line 181, in run_make_mode
    return make.run_generic_build(args[0])
  File "/home/leguark/.virtualenvs/gempy_dependencies/lib/python3.10/site-packages/sphinx/cmd/make_mode.py", line 169, in run_generic_build
    return build_main(args + opts)
  File "/home/leguark/.virtualenvs/gempy_dependencies/lib/python3.10/site-packages/sphinx/cmd/build.py", line 293, in build_main
    app = Sphinx(args.sourcedir, args.confdir, args.outputdir,
  File "/home/leguark/.virtualenvs/gempy_dependencies/lib/python3.10/site-packages/sphinx/application.py", line 272, in __init__
    self._init_builder()
  File "/home/leguark/.virtualenvs/gempy_dependencies/lib/python3.10/site-packages/sphinx/application.py", line 343, in _init_builder
    self.events.emit('builder-inited')
  File "/home/leguark/.virtualenvs/gempy_dependencies/lib/python3.10/site-packages/sphinx/events.py", line 97, in emit
    results.append(listener.handler(self.app, *args))
  File "/home/leguark/.virtualenvs/gempy_dependencies/lib/python3.10/site-packages/sphinx_gallery/gen_gallery.py", line 632, in generate_gallery_rst
    ) = generate_dir_rst(src_dir, target_dir, gallery_conf, seen_backrefs)
  File "/home/leguark/.virtualenvs/gempy_dependencies/lib/python3.10/site-packages/sphinx_gallery/gen_rst.py", line 531, in generate_dir_rst
    intro, title, (t, mem) = generate_file_rst(
  File "/home/leguark/.virtualenvs/gempy_dependencies/lib/python3.10/site-packages/sphinx_gallery/gen_rst.py", line 1203, in generate_file_rst
    output_blocks, time_elapsed = execute_script(
  File "/home/leguark/.virtualenvs/gempy_dependencies/lib/python3.10/site-packages/sphinx_gallery/gen_rst.py", line 1108, in execute_script
    execute_code_block(
  File "/home/leguark/.virtualenvs/gempy_dependencies/lib/python3.10/site-packages/sphinx_gallery/gen_rst.py", line 970, in execute_code_block
    is_last_expr, mem_max = _exec_and_get_memory(
  File "/home/leguark/.virtualenvs/gempy_dependencies/lib/python3.10/site-packages/sphinx_gallery/gen_rst.py", line 818, in _exec_and_get_memory
    mem_max, _ = gallery_conf["call_memory"](
  File "/home/leguark/.virtualenvs/gempy_dependencies/lib/python3.10/site-packages/sphinx_gallery/gen_gallery.py", line 244, in call_memory
    return 0.0, func()
  File "/home/leguark/.virtualenvs/gempy_dependencies/lib/python3.10/site-packages/sphinx_gallery/gen_rst.py", line 722, in __call__
    exec(self.code, self.fake_main.__dict__)
  File "/home/leguark/vector-geology/examples/02_structural_modeling/03_model_spremberg_import.py", line 17, in <module>
    from subsurface.core.geological_formats.boreholes.boreholes import BoreholeSet, MergeOptions
  File "/home/leguark/subsurface/subsurface/__init__.py", line 1, in <module>
    import subsurface.modules.reader
  File "/home/leguark/subsurface/subsurface/modules/reader/__init__.py", line 5, in <module>
    from .topography.topo_core import read_structured_topography, read_unstructured_topography
  File "/home/leguark/subsurface/subsurface/modules/reader/topography/topo_core.py", line 5, in <module>
    from ....core.structs.structured_elements.structured_grid import StructuredGrid
  File "/home/leguark/subsurface/subsurface/core/__init__.py", line 1, in <module>
    from . import geological_formats
  File "/home/leguark/subsurface/subsurface/core/geological_formats/__init__.py", line 1, in <module>
    from .boreholes.boreholes import BoreholeSet, Collars, Survey
  File "/home/leguark/subsurface/subsurface/core/geological_formats/boreholes/boreholes.py", line 6, in <module>
    from ._combine_trajectories import create_combined_trajectory, MergeOptions
  File "/home/leguark/subsurface/subsurface/core/geological_formats/boreholes/_combine_trajectories.py", line 5, in <module>
    from .collars import Collars
  File "/home/leguark/subsurface/subsurface/core/geological_formats/boreholes/collars.py", line 4, in <module>
    from ...structs.base_structures import UnstructuredData
  File "/home/leguark/subsurface/subsurface/core/structs/__init__.py", line 1, in <module>
    from .base_structures import StructuredData, UnstructuredData
  File "/home/leguark/subsurface/subsurface/core/structs/base_structures/__init__.py", line 1, in <module>
    from .unstructured_data import UnstructuredData
  File "/home/leguark/subsurface/subsurface/core/structs/base_structures/unstructured_data.py", line 6, in <module>
    import xarray as xr
  File "/home/leguark/.virtualenvs/gempy_dependencies/lib/python3.10/site-packages/xarray/__init__.py", line 3, in <module>
    from xarray import groupers, testing, tutorial
  File "/home/leguark/.virtualenvs/gempy_dependencies/lib/python3.10/site-packages/xarray/groupers.py", line 17, in <module>
    from xarray.coding.cftime_offsets import BaseCFTimeOffset, _new_to_legacy_freq
  File "/home/leguark/.virtualenvs/gempy_dependencies/lib/python3.10/site-packages/xarray/coding/cftime_offsets.py", line 56, in <module>
    from xarray.coding.cftimeindex import CFTimeIndex, _parse_iso8601_with_reso
  File "/home/leguark/.virtualenvs/gempy_dependencies/lib/python3.10/site-packages/xarray/coding/cftimeindex.py", line 54, in <module>
    from xarray.coding.times import (
  File "/home/leguark/.virtualenvs/gempy_dependencies/lib/python3.10/site-packages/xarray/coding/times.py", line 14, in <module>
    from xarray.coding.variables import (
  File "/home/leguark/.virtualenvs/gempy_dependencies/lib/python3.10/site-packages/xarray/coding/variables.py", line 14, in <module>
    from xarray.core.variable import Variable
  File "/home/leguark/.virtualenvs/gempy_dependencies/lib/python3.10/site-packages/xarray/core/variable.py", line 20, in <module>
    from xarray.core import common, dtypes, duck_array_ops, indexing, nputils, ops, utils
  File "/home/leguark/.virtualenvs/gempy_dependencies/lib/python3.10/site-packages/xarray/core/common.py", line 28, in <module>
    import cftime
  File "/home/leguark/.virtualenvs/gempy_dependencies/lib/python3.10/site-packages/cftime/__init__.py", line 1, in <module>
    from ._cftime import (datetime, real_datetime,

A module that was compiled using NumPy 1.x cannot be run in
NumPy 2.1.1 as it may crash. To support both 1.x and 2.x
versions of NumPy, modules must be compiled with NumPy 2.0.
Some module may need to rebuild instead e.g. with 'pybind11>=2.12'.

If you are a user of the module, the easiest solution will be to
downgrade to 'numpy<2' or try to upgrade the affected module.
We expect that some modules will need time to support NumPy 2.

Traceback (most recent call last):  File "/home/leguark/.virtualenvs/gempy_dependencies/bin/sphinx-build", line 8, in <module>
    sys.exit(main())
  File "/home/leguark/.virtualenvs/gempy_dependencies/lib/python3.10/site-packages/sphinx/cmd/build.py", line 339, in main
    return make_main(argv)
  File "/home/leguark/.virtualenvs/gempy_dependencies/lib/python3.10/site-packages/sphinx/cmd/build.py", line 213, in make_main
    return make_mode.run_make_mode(argv[1:])
  File "/home/leguark/.virtualenvs/gempy_dependencies/lib/python3.10/site-packages/sphinx/cmd/make_mode.py", line 181, in run_make_mode
    return make.run_generic_build(args[0])
  File "/home/leguark/.virtualenvs/gempy_dependencies/lib/python3.10/site-packages/sphinx/cmd/make_mode.py", line 169, in run_generic_build
    return build_main(args + opts)
  File "/home/leguark/.virtualenvs/gempy_dependencies/lib/python3.10/site-packages/sphinx/cmd/build.py", line 293, in build_main
    app = Sphinx(args.sourcedir, args.confdir, args.outputdir,
  File "/home/leguark/.virtualenvs/gempy_dependencies/lib/python3.10/site-packages/sphinx/application.py", line 272, in __init__
    self._init_builder()
  File "/home/leguark/.virtualenvs/gempy_dependencies/lib/python3.10/site-packages/sphinx/application.py", line 343, in _init_builder
    self.events.emit('builder-inited')
  File "/home/leguark/.virtualenvs/gempy_dependencies/lib/python3.10/site-packages/sphinx/events.py", line 97, in emit
    results.append(listener.handler(self.app, *args))
  File "/home/leguark/.virtualenvs/gempy_dependencies/lib/python3.10/site-packages/sphinx_gallery/gen_gallery.py", line 632, in generate_gallery_rst
    ) = generate_dir_rst(src_dir, target_dir, gallery_conf, seen_backrefs)
  File "/home/leguark/.virtualenvs/gempy_dependencies/lib/python3.10/site-packages/sphinx_gallery/gen_rst.py", line 531, in generate_dir_rst
    intro, title, (t, mem) = generate_file_rst(
  File "/home/leguark/.virtualenvs/gempy_dependencies/lib/python3.10/site-packages/sphinx_gallery/gen_rst.py", line 1203, in generate_file_rst
    output_blocks, time_elapsed = execute_script(
  File "/home/leguark/.virtualenvs/gempy_dependencies/lib/python3.10/site-packages/sphinx_gallery/gen_rst.py", line 1108, in execute_script
    execute_code_block(
  File "/home/leguark/.virtualenvs/gempy_dependencies/lib/python3.10/site-packages/sphinx_gallery/gen_rst.py", line 970, in execute_code_block
    is_last_expr, mem_max = _exec_and_get_memory(
  File "/home/leguark/.virtualenvs/gempy_dependencies/lib/python3.10/site-packages/sphinx_gallery/gen_rst.py", line 818, in _exec_and_get_memory
    mem_max, _ = gallery_conf["call_memory"](
  File "/home/leguark/.virtualenvs/gempy_dependencies/lib/python3.10/site-packages/sphinx_gallery/gen_gallery.py", line 244, in call_memory
    return 0.0, func()
  File "/home/leguark/.virtualenvs/gempy_dependencies/lib/python3.10/site-packages/sphinx_gallery/gen_rst.py", line 722, in __call__
    exec(self.code, self.fake_main.__dict__)
  File "/home/leguark/vector-geology/examples/02_structural_modeling/03_model_spremberg_import.py", line 17, in <module>
    from subsurface.core.geological_formats.boreholes.boreholes import BoreholeSet, MergeOptions
  File "/home/leguark/subsurface/subsurface/__init__.py", line 1, in <module>
    import subsurface.modules.reader
  File "/home/leguark/subsurface/subsurface/modules/reader/__init__.py", line 5, in <module>
    from .topography.topo_core import read_structured_topography, read_unstructured_topography
  File "/home/leguark/subsurface/subsurface/modules/reader/topography/topo_core.py", line 5, in <module>
    from ....core.structs.structured_elements.structured_grid import StructuredGrid
  File "/home/leguark/subsurface/subsurface/core/__init__.py", line 1, in <module>
    from . import geological_formats
  File "/home/leguark/subsurface/subsurface/core/geological_formats/__init__.py", line 1, in <module>
    from .boreholes.boreholes import BoreholeSet, Collars, Survey
  File "/home/leguark/subsurface/subsurface/core/geological_formats/boreholes/boreholes.py", line 6, in <module>
    from ._combine_trajectories import create_combined_trajectory, MergeOptions
  File "/home/leguark/subsurface/subsurface/core/geological_formats/boreholes/_combine_trajectories.py", line 5, in <module>
    from .collars import Collars
  File "/home/leguark/subsurface/subsurface/core/geological_formats/boreholes/collars.py", line 4, in <module>
    from ...structs.base_structures import UnstructuredData
  File "/home/leguark/subsurface/subsurface/core/structs/__init__.py", line 1, in <module>
    from .base_structures import StructuredData, UnstructuredData
  File "/home/leguark/subsurface/subsurface/core/structs/base_structures/__init__.py", line 1, in <module>
    from .unstructured_data import UnstructuredData
  File "/home/leguark/subsurface/subsurface/core/structs/base_structures/unstructured_data.py", line 6, in <module>
    import xarray as xr
  File "/home/leguark/.virtualenvs/gempy_dependencies/lib/python3.10/site-packages/xarray/__init__.py", line 3, in <module>
    from xarray import groupers, testing, tutorial
  File "/home/leguark/.virtualenvs/gempy_dependencies/lib/python3.10/site-packages/xarray/groupers.py", line 17, in <module>
    from xarray.coding.cftime_offsets import BaseCFTimeOffset, _new_to_legacy_freq
  File "/home/leguark/.virtualenvs/gempy_dependencies/lib/python3.10/site-packages/xarray/coding/cftime_offsets.py", line 56, in <module>
    from xarray.coding.cftimeindex import CFTimeIndex, _parse_iso8601_with_reso
  File "/home/leguark/.virtualenvs/gempy_dependencies/lib/python3.10/site-packages/xarray/coding/cftimeindex.py", line 54, in <module>
    from xarray.coding.times import (
  File "/home/leguark/.virtualenvs/gempy_dependencies/lib/python3.10/site-packages/xarray/coding/times.py", line 35, in <module>
    import cftime
  File "/home/leguark/.virtualenvs/gempy_dependencies/lib/python3.10/site-packages/cftime/__init__.py", line 1, in <module>
    from ._cftime import (datetime, real_datetime,

A module that was compiled using NumPy 1.x cannot be run in
NumPy 2.1.1 as it may crash. To support both 1.x and 2.x
versions of NumPy, modules must be compiled with NumPy 2.0.
Some module may need to rebuild instead e.g. with 'pybind11>=2.12'.

If you are a user of the module, the easiest solution will be to
downgrade to 'numpy<2' or try to upgrade the affected module.
We expect that some modules will need time to support NumPy 2.

Traceback (most recent call last):  File "/home/leguark/.virtualenvs/gempy_dependencies/bin/sphinx-build", line 8, in <module>
    sys.exit(main())
  File "/home/leguark/.virtualenvs/gempy_dependencies/lib/python3.10/site-packages/sphinx/cmd/build.py", line 339, in main
    return make_main(argv)
  File "/home/leguark/.virtualenvs/gempy_dependencies/lib/python3.10/site-packages/sphinx/cmd/build.py", line 213, in make_main
    return make_mode.run_make_mode(argv[1:])
  File "/home/leguark/.virtualenvs/gempy_dependencies/lib/python3.10/site-packages/sphinx/cmd/make_mode.py", line 181, in run_make_mode
    return make.run_generic_build(args[0])
  File "/home/leguark/.virtualenvs/gempy_dependencies/lib/python3.10/site-packages/sphinx/cmd/make_mode.py", line 169, in run_generic_build
    return build_main(args + opts)
  File "/home/leguark/.virtualenvs/gempy_dependencies/lib/python3.10/site-packages/sphinx/cmd/build.py", line 293, in build_main
    app = Sphinx(args.sourcedir, args.confdir, args.outputdir,
  File "/home/leguark/.virtualenvs/gempy_dependencies/lib/python3.10/site-packages/sphinx/application.py", line 272, in __init__
    self._init_builder()
  File "/home/leguark/.virtualenvs/gempy_dependencies/lib/python3.10/site-packages/sphinx/application.py", line 343, in _init_builder
    self.events.emit('builder-inited')
  File "/home/leguark/.virtualenvs/gempy_dependencies/lib/python3.10/site-packages/sphinx/events.py", line 97, in emit
    results.append(listener.handler(self.app, *args))
  File "/home/leguark/.virtualenvs/gempy_dependencies/lib/python3.10/site-packages/sphinx_gallery/gen_gallery.py", line 632, in generate_gallery_rst
    ) = generate_dir_rst(src_dir, target_dir, gallery_conf, seen_backrefs)
  File "/home/leguark/.virtualenvs/gempy_dependencies/lib/python3.10/site-packages/sphinx_gallery/gen_rst.py", line 531, in generate_dir_rst
    intro, title, (t, mem) = generate_file_rst(
  File "/home/leguark/.virtualenvs/gempy_dependencies/lib/python3.10/site-packages/sphinx_gallery/gen_rst.py", line 1203, in generate_file_rst
    output_blocks, time_elapsed = execute_script(
  File "/home/leguark/.virtualenvs/gempy_dependencies/lib/python3.10/site-packages/sphinx_gallery/gen_rst.py", line 1108, in execute_script
    execute_code_block(
  File "/home/leguark/.virtualenvs/gempy_dependencies/lib/python3.10/site-packages/sphinx_gallery/gen_rst.py", line 970, in execute_code_block
    is_last_expr, mem_max = _exec_and_get_memory(
  File "/home/leguark/.virtualenvs/gempy_dependencies/lib/python3.10/site-packages/sphinx_gallery/gen_rst.py", line 818, in _exec_and_get_memory
    mem_max, _ = gallery_conf["call_memory"](
  File "/home/leguark/.virtualenvs/gempy_dependencies/lib/python3.10/site-packages/sphinx_gallery/gen_gallery.py", line 244, in call_memory
    return 0.0, func()
  File "/home/leguark/.virtualenvs/gempy_dependencies/lib/python3.10/site-packages/sphinx_gallery/gen_rst.py", line 722, in __call__
    exec(self.code, self.fake_main.__dict__)
  File "/home/leguark/vector-geology/examples/02_structural_modeling/03_model_spremberg_import.py", line 17, in <module>
    from subsurface.core.geological_formats.boreholes.boreholes import BoreholeSet, MergeOptions
  File "/home/leguark/subsurface/subsurface/__init__.py", line 1, in <module>
    import subsurface.modules.reader
  File "/home/leguark/subsurface/subsurface/modules/reader/__init__.py", line 5, in <module>
    from .topography.topo_core import read_structured_topography, read_unstructured_topography
  File "/home/leguark/subsurface/subsurface/modules/reader/topography/topo_core.py", line 5, in <module>
    from ....core.structs.structured_elements.structured_grid import StructuredGrid
  File "/home/leguark/subsurface/subsurface/core/__init__.py", line 1, in <module>
    from . import geological_formats
  File "/home/leguark/subsurface/subsurface/core/geological_formats/__init__.py", line 1, in <module>
    from .boreholes.boreholes import BoreholeSet, Collars, Survey
  File "/home/leguark/subsurface/subsurface/core/geological_formats/boreholes/boreholes.py", line 6, in <module>
    from ._combine_trajectories import create_combined_trajectory, MergeOptions
  File "/home/leguark/subsurface/subsurface/core/geological_formats/boreholes/_combine_trajectories.py", line 5, in <module>
    from .collars import Collars
  File "/home/leguark/subsurface/subsurface/core/geological_formats/boreholes/collars.py", line 4, in <module>
    from ...structs.base_structures import UnstructuredData
  File "/home/leguark/subsurface/subsurface/core/structs/__init__.py", line 1, in <module>
    from .base_structures import StructuredData, UnstructuredData
  File "/home/leguark/subsurface/subsurface/core/structs/base_structures/__init__.py", line 1, in <module>
    from .unstructured_data import UnstructuredData
  File "/home/leguark/subsurface/subsurface/core/structs/base_structures/unstructured_data.py", line 6, in <module>
    import xarray as xr
  File "/home/leguark/.virtualenvs/gempy_dependencies/lib/python3.10/site-packages/xarray/__init__.py", line 3, in <module>
    from xarray import groupers, testing, tutorial
  File "/home/leguark/.virtualenvs/gempy_dependencies/lib/python3.10/site-packages/xarray/groupers.py", line 17, in <module>
    from xarray.coding.cftime_offsets import BaseCFTimeOffset, _new_to_legacy_freq
  File "/home/leguark/.virtualenvs/gempy_dependencies/lib/python3.10/site-packages/xarray/coding/cftime_offsets.py", line 56, in <module>
    from xarray.coding.cftimeindex import CFTimeIndex, _parse_iso8601_with_reso
  File "/home/leguark/.virtualenvs/gempy_dependencies/lib/python3.10/site-packages/xarray/coding/cftimeindex.py", line 64, in <module>
    import cftime
  File "/home/leguark/.virtualenvs/gempy_dependencies/lib/python3.10/site-packages/cftime/__init__.py", line 1, in <module>
    from ._cftime import (datetime, real_datetime,

A module that was compiled using NumPy 1.x cannot be run in
NumPy 2.1.1 as it may crash. To support both 1.x and 2.x
versions of NumPy, modules must be compiled with NumPy 2.0.
Some module may need to rebuild instead e.g. with 'pybind11>=2.12'.

If you are a user of the module, the easiest solution will be to
downgrade to 'numpy<2' or try to upgrade the affected module.
We expect that some modules will need time to support NumPy 2.

Traceback (most recent call last):  File "/home/leguark/.virtualenvs/gempy_dependencies/bin/sphinx-build", line 8, in <module>
    sys.exit(main())
  File "/home/leguark/.virtualenvs/gempy_dependencies/lib/python3.10/site-packages/sphinx/cmd/build.py", line 339, in main
    return make_main(argv)
  File "/home/leguark/.virtualenvs/gempy_dependencies/lib/python3.10/site-packages/sphinx/cmd/build.py", line 213, in make_main
    return make_mode.run_make_mode(argv[1:])
  File "/home/leguark/.virtualenvs/gempy_dependencies/lib/python3.10/site-packages/sphinx/cmd/make_mode.py", line 181, in run_make_mode
    return make.run_generic_build(args[0])
  File "/home/leguark/.virtualenvs/gempy_dependencies/lib/python3.10/site-packages/sphinx/cmd/make_mode.py", line 169, in run_generic_build
    return build_main(args + opts)
  File "/home/leguark/.virtualenvs/gempy_dependencies/lib/python3.10/site-packages/sphinx/cmd/build.py", line 293, in build_main
    app = Sphinx(args.sourcedir, args.confdir, args.outputdir,
  File "/home/leguark/.virtualenvs/gempy_dependencies/lib/python3.10/site-packages/sphinx/application.py", line 272, in __init__
    self._init_builder()
  File "/home/leguark/.virtualenvs/gempy_dependencies/lib/python3.10/site-packages/sphinx/application.py", line 343, in _init_builder
    self.events.emit('builder-inited')
  File "/home/leguark/.virtualenvs/gempy_dependencies/lib/python3.10/site-packages/sphinx/events.py", line 97, in emit
    results.append(listener.handler(self.app, *args))
  File "/home/leguark/.virtualenvs/gempy_dependencies/lib/python3.10/site-packages/sphinx_gallery/gen_gallery.py", line 632, in generate_gallery_rst
    ) = generate_dir_rst(src_dir, target_dir, gallery_conf, seen_backrefs)
  File "/home/leguark/.virtualenvs/gempy_dependencies/lib/python3.10/site-packages/sphinx_gallery/gen_rst.py", line 531, in generate_dir_rst
    intro, title, (t, mem) = generate_file_rst(
  File "/home/leguark/.virtualenvs/gempy_dependencies/lib/python3.10/site-packages/sphinx_gallery/gen_rst.py", line 1203, in generate_file_rst
    output_blocks, time_elapsed = execute_script(
  File "/home/leguark/.virtualenvs/gempy_dependencies/lib/python3.10/site-packages/sphinx_gallery/gen_rst.py", line 1108, in execute_script
    execute_code_block(
  File "/home/leguark/.virtualenvs/gempy_dependencies/lib/python3.10/site-packages/sphinx_gallery/gen_rst.py", line 970, in execute_code_block
    is_last_expr, mem_max = _exec_and_get_memory(
  File "/home/leguark/.virtualenvs/gempy_dependencies/lib/python3.10/site-packages/sphinx_gallery/gen_rst.py", line 818, in _exec_and_get_memory
    mem_max, _ = gallery_conf["call_memory"](
  File "/home/leguark/.virtualenvs/gempy_dependencies/lib/python3.10/site-packages/sphinx_gallery/gen_gallery.py", line 244, in call_memory
    return 0.0, func()
  File "/home/leguark/.virtualenvs/gempy_dependencies/lib/python3.10/site-packages/sphinx_gallery/gen_rst.py", line 722, in __call__
    exec(self.code, self.fake_main.__dict__)
  File "/home/leguark/vector-geology/examples/02_structural_modeling/03_model_spremberg_import.py", line 17, in <module>
    from subsurface.core.geological_formats.boreholes.boreholes import BoreholeSet, MergeOptions
  File "/home/leguark/subsurface/subsurface/__init__.py", line 1, in <module>
    import subsurface.modules.reader
  File "/home/leguark/subsurface/subsurface/modules/reader/__init__.py", line 5, in <module>
    from .topography.topo_core import read_structured_topography, read_unstructured_topography
  File "/home/leguark/subsurface/subsurface/modules/reader/topography/topo_core.py", line 5, in <module>
    from ....core.structs.structured_elements.structured_grid import StructuredGrid
  File "/home/leguark/subsurface/subsurface/core/__init__.py", line 1, in <module>
    from . import geological_formats
  File "/home/leguark/subsurface/subsurface/core/geological_formats/__init__.py", line 1, in <module>
    from .boreholes.boreholes import BoreholeSet, Collars, Survey
  File "/home/leguark/subsurface/subsurface/core/geological_formats/boreholes/boreholes.py", line 6, in <module>
    from ._combine_trajectories import create_combined_trajectory, MergeOptions
  File "/home/leguark/subsurface/subsurface/core/geological_formats/boreholes/_combine_trajectories.py", line 5, in <module>
    from .collars import Collars
  File "/home/leguark/subsurface/subsurface/core/geological_formats/boreholes/collars.py", line 4, in <module>
    from ...structs.base_structures import UnstructuredData
  File "/home/leguark/subsurface/subsurface/core/structs/__init__.py", line 1, in <module>
    from .base_structures import StructuredData, UnstructuredData
  File "/home/leguark/subsurface/subsurface/core/structs/base_structures/__init__.py", line 1, in <module>
    from .unstructured_data import UnstructuredData
  File "/home/leguark/subsurface/subsurface/core/structs/base_structures/unstructured_data.py", line 6, in <module>
    import xarray as xr
  File "/home/leguark/.virtualenvs/gempy_dependencies/lib/python3.10/site-packages/xarray/__init__.py", line 3, in <module>
    from xarray import groupers, testing, tutorial
  File "/home/leguark/.virtualenvs/gempy_dependencies/lib/python3.10/site-packages/xarray/groupers.py", line 17, in <module>
    from xarray.coding.cftime_offsets import BaseCFTimeOffset, _new_to_legacy_freq
  File "/home/leguark/.virtualenvs/gempy_dependencies/lib/python3.10/site-packages/xarray/coding/cftime_offsets.py", line 73, in <module>
    import cftime
  File "/home/leguark/.virtualenvs/gempy_dependencies/lib/python3.10/site-packages/cftime/__init__.py", line 1, in <module>
    from ._cftime import (datetime, real_datetime,

A module that was compiled using NumPy 1.x cannot be run in
NumPy 2.1.1 as it may crash. To support both 1.x and 2.x
versions of NumPy, modules must be compiled with NumPy 2.0.
Some module may need to rebuild instead e.g. with 'pybind11>=2.12'.

If you are a user of the module, the easiest solution will be to
downgrade to 'numpy<2' or try to upgrade the affected module.
We expect that some modules will need time to support NumPy 2.

Traceback (most recent call last):  File "/home/leguark/.virtualenvs/gempy_dependencies/bin/sphinx-build", line 8, in <module>
    sys.exit(main())
  File "/home/leguark/.virtualenvs/gempy_dependencies/lib/python3.10/site-packages/sphinx/cmd/build.py", line 339, in main
    return make_main(argv)
  File "/home/leguark/.virtualenvs/gempy_dependencies/lib/python3.10/site-packages/sphinx/cmd/build.py", line 213, in make_main
    return make_mode.run_make_mode(argv[1:])
  File "/home/leguark/.virtualenvs/gempy_dependencies/lib/python3.10/site-packages/sphinx/cmd/make_mode.py", line 181, in run_make_mode
    return make.run_generic_build(args[0])
  File "/home/leguark/.virtualenvs/gempy_dependencies/lib/python3.10/site-packages/sphinx/cmd/make_mode.py", line 169, in run_generic_build
    return build_main(args + opts)
  File "/home/leguark/.virtualenvs/gempy_dependencies/lib/python3.10/site-packages/sphinx/cmd/build.py", line 293, in build_main
    app = Sphinx(args.sourcedir, args.confdir, args.outputdir,
  File "/home/leguark/.virtualenvs/gempy_dependencies/lib/python3.10/site-packages/sphinx/application.py", line 272, in __init__
    self._init_builder()
  File "/home/leguark/.virtualenvs/gempy_dependencies/lib/python3.10/site-packages/sphinx/application.py", line 343, in _init_builder
    self.events.emit('builder-inited')
  File "/home/leguark/.virtualenvs/gempy_dependencies/lib/python3.10/site-packages/sphinx/events.py", line 97, in emit
    results.append(listener.handler(self.app, *args))
  File "/home/leguark/.virtualenvs/gempy_dependencies/lib/python3.10/site-packages/sphinx_gallery/gen_gallery.py", line 632, in generate_gallery_rst
    ) = generate_dir_rst(src_dir, target_dir, gallery_conf, seen_backrefs)
  File "/home/leguark/.virtualenvs/gempy_dependencies/lib/python3.10/site-packages/sphinx_gallery/gen_rst.py", line 531, in generate_dir_rst
    intro, title, (t, mem) = generate_file_rst(
  File "/home/leguark/.virtualenvs/gempy_dependencies/lib/python3.10/site-packages/sphinx_gallery/gen_rst.py", line 1203, in generate_file_rst
    output_blocks, time_elapsed = execute_script(
  File "/home/leguark/.virtualenvs/gempy_dependencies/lib/python3.10/site-packages/sphinx_gallery/gen_rst.py", line 1108, in execute_script
    execute_code_block(
  File "/home/leguark/.virtualenvs/gempy_dependencies/lib/python3.10/site-packages/sphinx_gallery/gen_rst.py", line 970, in execute_code_block
    is_last_expr, mem_max = _exec_and_get_memory(
  File "/home/leguark/.virtualenvs/gempy_dependencies/lib/python3.10/site-packages/sphinx_gallery/gen_rst.py", line 818, in _exec_and_get_memory
    mem_max, _ = gallery_conf["call_memory"](
  File "/home/leguark/.virtualenvs/gempy_dependencies/lib/python3.10/site-packages/sphinx_gallery/gen_gallery.py", line 244, in call_memory
    return 0.0, func()
  File "/home/leguark/.virtualenvs/gempy_dependencies/lib/python3.10/site-packages/sphinx_gallery/gen_rst.py", line 722, in __call__
    exec(self.code, self.fake_main.__dict__)
  File "/home/leguark/vector-geology/examples/02_structural_modeling/03_model_spremberg_import.py", line 17, in <module>
    from subsurface.core.geological_formats.boreholes.boreholes import BoreholeSet, MergeOptions
  File "/home/leguark/subsurface/subsurface/__init__.py", line 1, in <module>
    import subsurface.modules.reader
  File "/home/leguark/subsurface/subsurface/modules/reader/__init__.py", line 5, in <module>
    from .topography.topo_core import read_structured_topography, read_unstructured_topography
  File "/home/leguark/subsurface/subsurface/modules/reader/topography/topo_core.py", line 5, in <module>
    from ....core.structs.structured_elements.structured_grid import StructuredGrid
  File "/home/leguark/subsurface/subsurface/core/__init__.py", line 1, in <module>
    from . import geological_formats
  File "/home/leguark/subsurface/subsurface/core/geological_formats/__init__.py", line 1, in <module>
    from .boreholes.boreholes import BoreholeSet, Collars, Survey
  File "/home/leguark/subsurface/subsurface/core/geological_formats/boreholes/boreholes.py", line 6, in <module>
    from ._combine_trajectories import create_combined_trajectory, MergeOptions
  File "/home/leguark/subsurface/subsurface/core/geological_formats/boreholes/_combine_trajectories.py", line 5, in <module>
    from .collars import Collars
  File "/home/leguark/subsurface/subsurface/core/geological_formats/boreholes/collars.py", line 4, in <module>
    from ...structs.base_structures import UnstructuredData
  File "/home/leguark/subsurface/subsurface/core/structs/__init__.py", line 1, in <module>
    from .base_structures import StructuredData, UnstructuredData
  File "/home/leguark/subsurface/subsurface/core/structs/base_structures/__init__.py", line 1, in <module>
    from .unstructured_data import UnstructuredData
  File "/home/leguark/subsurface/subsurface/core/structs/base_structures/unstructured_data.py", line 6, in <module>
    import xarray as xr
  File "/home/leguark/.virtualenvs/gempy_dependencies/lib/python3.10/site-packages/xarray/__init__.py", line 3, in <module>
    from xarray import groupers, testing, tutorial
  File "/home/leguark/.virtualenvs/gempy_dependencies/lib/python3.10/site-packages/xarray/groupers.py", line 20, in <module>
    from xarray.core.dataarray import DataArray
  File "/home/leguark/.virtualenvs/gempy_dependencies/lib/python3.10/site-packages/xarray/core/dataarray.py", line 29, in <module>
    from xarray.coding.calendar_ops import convert_calendar, interp_calendar
  File "/home/leguark/.virtualenvs/gempy_dependencies/lib/python3.10/site-packages/xarray/coding/calendar_ops.py", line 20, in <module>
    import cftime
  File "/home/leguark/.virtualenvs/gempy_dependencies/lib/python3.10/site-packages/cftime/__init__.py", line 1, in <module>
    from ._cftime import (datetime, real_datetime,

A module that was compiled using NumPy 1.x cannot be run in
NumPy 2.1.1 as it may crash. To support both 1.x and 2.x
versions of NumPy, modules must be compiled with NumPy 2.0.
Some module may need to rebuild instead e.g. with 'pybind11>=2.12'.

If you are a user of the module, the easiest solution will be to
downgrade to 'numpy<2' or try to upgrade the affected module.
We expect that some modules will need time to support NumPy 2.

Traceback (most recent call last):  File "/home/leguark/.virtualenvs/gempy_dependencies/bin/sphinx-build", line 8, in <module>
    sys.exit(main())
  File "/home/leguark/.virtualenvs/gempy_dependencies/lib/python3.10/site-packages/sphinx/cmd/build.py", line 339, in main
    return make_main(argv)
  File "/home/leguark/.virtualenvs/gempy_dependencies/lib/python3.10/site-packages/sphinx/cmd/build.py", line 213, in make_main
    return make_mode.run_make_mode(argv[1:])
  File "/home/leguark/.virtualenvs/gempy_dependencies/lib/python3.10/site-packages/sphinx/cmd/make_mode.py", line 181, in run_make_mode
    return make.run_generic_build(args[0])
  File "/home/leguark/.virtualenvs/gempy_dependencies/lib/python3.10/site-packages/sphinx/cmd/make_mode.py", line 169, in run_generic_build
    return build_main(args + opts)
  File "/home/leguark/.virtualenvs/gempy_dependencies/lib/python3.10/site-packages/sphinx/cmd/build.py", line 293, in build_main
    app = Sphinx(args.sourcedir, args.confdir, args.outputdir,
  File "/home/leguark/.virtualenvs/gempy_dependencies/lib/python3.10/site-packages/sphinx/application.py", line 272, in __init__
    self._init_builder()
  File "/home/leguark/.virtualenvs/gempy_dependencies/lib/python3.10/site-packages/sphinx/application.py", line 343, in _init_builder
    self.events.emit('builder-inited')
  File "/home/leguark/.virtualenvs/gempy_dependencies/lib/python3.10/site-packages/sphinx/events.py", line 97, in emit
    results.append(listener.handler(self.app, *args))
  File "/home/leguark/.virtualenvs/gempy_dependencies/lib/python3.10/site-packages/sphinx_gallery/gen_gallery.py", line 632, in generate_gallery_rst
    ) = generate_dir_rst(src_dir, target_dir, gallery_conf, seen_backrefs)
  File "/home/leguark/.virtualenvs/gempy_dependencies/lib/python3.10/site-packages/sphinx_gallery/gen_rst.py", line 531, in generate_dir_rst
    intro, title, (t, mem) = generate_file_rst(
  File "/home/leguark/.virtualenvs/gempy_dependencies/lib/python3.10/site-packages/sphinx_gallery/gen_rst.py", line 1203, in generate_file_rst
    output_blocks, time_elapsed = execute_script(
  File "/home/leguark/.virtualenvs/gempy_dependencies/lib/python3.10/site-packages/sphinx_gallery/gen_rst.py", line 1108, in execute_script
    execute_code_block(
  File "/home/leguark/.virtualenvs/gempy_dependencies/lib/python3.10/site-packages/sphinx_gallery/gen_rst.py", line 970, in execute_code_block
    is_last_expr, mem_max = _exec_and_get_memory(
  File "/home/leguark/.virtualenvs/gempy_dependencies/lib/python3.10/site-packages/sphinx_gallery/gen_rst.py", line 818, in _exec_and_get_memory
    mem_max, _ = gallery_conf["call_memory"](
  File "/home/leguark/.virtualenvs/gempy_dependencies/lib/python3.10/site-packages/sphinx_gallery/gen_gallery.py", line 244, in call_memory
    return 0.0, func()
  File "/home/leguark/.virtualenvs/gempy_dependencies/lib/python3.10/site-packages/sphinx_gallery/gen_rst.py", line 722, in __call__
    exec(self.code, self.fake_main.__dict__)
  File "/home/leguark/vector-geology/examples/02_structural_modeling/03_model_spremberg_import.py", line 17, in <module>
    from subsurface.core.geological_formats.boreholes.boreholes import BoreholeSet, MergeOptions
  File "/home/leguark/subsurface/subsurface/__init__.py", line 1, in <module>
    import subsurface.modules.reader
  File "/home/leguark/subsurface/subsurface/modules/reader/__init__.py", line 5, in <module>
    from .topography.topo_core import read_structured_topography, read_unstructured_topography
  File "/home/leguark/subsurface/subsurface/modules/reader/topography/topo_core.py", line 5, in <module>
    from ....core.structs.structured_elements.structured_grid import StructuredGrid
  File "/home/leguark/subsurface/subsurface/core/__init__.py", line 1, in <module>
    from . import geological_formats
  File "/home/leguark/subsurface/subsurface/core/geological_formats/__init__.py", line 1, in <module>
    from .boreholes.boreholes import BoreholeSet, Collars, Survey
  File "/home/leguark/subsurface/subsurface/core/geological_formats/boreholes/boreholes.py", line 6, in <module>
    from ._combine_trajectories import create_combined_trajectory, MergeOptions
  File "/home/leguark/subsurface/subsurface/core/geological_formats/boreholes/_combine_trajectories.py", line 5, in <module>
    from .collars import Collars
  File "/home/leguark/subsurface/subsurface/core/geological_formats/boreholes/collars.py", line 4, in <module>
    from ...structs.base_structures import UnstructuredData
  File "/home/leguark/subsurface/subsurface/core/structs/__init__.py", line 1, in <module>
    from .base_structures import StructuredData, UnstructuredData
  File "/home/leguark/subsurface/subsurface/core/structs/base_structures/__init__.py", line 1, in <module>
    from .unstructured_data import UnstructuredData
  File "/home/leguark/subsurface/subsurface/core/structs/base_structures/unstructured_data.py", line 6, in <module>
    import xarray as xr
  File "/home/leguark/.virtualenvs/gempy_dependencies/lib/python3.10/site-packages/xarray/__init__.py", line 3, in <module>
    from xarray import groupers, testing, tutorial
  File "/home/leguark/.virtualenvs/gempy_dependencies/lib/python3.10/site-packages/xarray/groupers.py", line 20, in <module>
    from xarray.core.dataarray import DataArray
  File "/home/leguark/.virtualenvs/gempy_dependencies/lib/python3.10/site-packages/xarray/core/dataarray.py", line 49, in <module>
    from xarray.core.dataset import Dataset
  File "/home/leguark/.virtualenvs/gempy_dependencies/lib/python3.10/site-packages/xarray/core/dataset.py", line 131, in <module>
    from xarray.plot.accessor import DatasetPlotAccessor
  File "/home/leguark/.virtualenvs/gempy_dependencies/lib/python3.10/site-packages/xarray/plot/__init__.py", line 10, in <module>
    from xarray.plot.dataarray_plot import (
  File "/home/leguark/.virtualenvs/gempy_dependencies/lib/python3.10/site-packages/xarray/plot/dataarray_plot.py", line 13, in <module>
    from xarray.plot.facetgrid import _easy_facetgrid
  File "/home/leguark/.virtualenvs/gempy_dependencies/lib/python3.10/site-packages/xarray/plot/facetgrid.py", line 13, in <module>
    from xarray.plot.utils import (
  File "/home/leguark/.virtualenvs/gempy_dependencies/lib/python3.10/site-packages/xarray/plot/utils.py", line 30, in <module>
    import cftime
  File "/home/leguark/.virtualenvs/gempy_dependencies/lib/python3.10/site-packages/cftime/__init__.py", line 1, in <module>
    from ._cftime import (datetime, real_datetime,
Python-dotenv could not parse statement starting at line 13
Python-dotenv could not parse statement starting at line 14
Python-dotenv could not parse statement starting at line 15
Python-dotenv could not parse statement starting at line 16
Initialize the reader for the lithological data. Specify the file path and column mappings.
import dotenv
dotenv.load_dotenv()
reader: GenericReaderFilesHelper = GenericReaderFilesHelper(
    file_or_buffer=os.getenv("PATH_TO_SPREMBERG_STRATIGRAPHY"),
    columns_map={
            'hole_id'   : 'id',
            'depth_from': 'top',
            'depth_to'  : 'base',
            'lit_code'  : 'component lith'
    }
)

# Read the lithological data into a DataFrame.
lith: pd.DataFrame = read_lith(reader)
Python-dotenv could not parse statement starting at line 13
Python-dotenv could not parse statement starting at line 14
Python-dotenv could not parse statement starting at line 15
Python-dotenv could not parse statement starting at line 16
/home/leguark/subsurface/subsurface/modules/reader/wells/_read_to_df.py:13: ParserWarning: Falling back to the 'python' engine because the 'c' engine does not support sep=None with delim_whitespace=False; you can avoid this warning by specifying engine='python'.
  d = reader(
/home/leguark/subsurface/subsurface/modules/reader/wells/read_borehole_interface.py:130: SettingWithCopyWarning:
A value is trying to be set on a copy of a slice from a DataFrame.
Try using .loc[row_indexer,col_indexer] = value instead

See the caveats in the documentation: https://pandas.pydata.org/pandas-docs/stable/user_guide/indexing.html#returning-a-view-versus-a-copy
  lith_df['top'] = np.abs(lith_df['top'])
/home/leguark/subsurface/subsurface/modules/reader/wells/read_borehole_interface.py:131: SettingWithCopyWarning:
A value is trying to be set on a copy of a slice from a DataFrame.
Try using .loc[row_indexer,col_indexer] = value instead

See the caveats in the documentation: https://pandas.pydata.org/pandas-docs/stable/user_guide/indexing.html#returning-a-view-versus-a-copy
  lith_df['base'] = np.abs(lith_df['base'])
Initialize the reader for the survey data. Specify the file path and column mappings.
reader: GenericReaderFilesHelper = GenericReaderFilesHelper(
    file_or_buffer=os.getenv("PATH_TO_SPREMBERG_SURVEY"),
    columns_map={
            'depth'  : 'md',
            'dip'    : 'dip',
            'azimuth': 'azi'
    },
)

# Read the survey data into a DataFrame.
df = read_survey(reader)
/home/leguark/subsurface/subsurface/modules/reader/wells/_read_to_df.py:13: ParserWarning: Falling back to the 'python' engine because the 'c' engine does not support sep=None with delim_whitespace=False; you can avoid this warning by specifying engine='python'.
  d = reader(
Create a Survey object from the DataFrame and update it with lithological data.
survey: Survey = Survey.from_df(
    survey_df=df,
    attr_df=None
)
survey.update_survey_with_lith(lith)
Well '13E_56' does not exist in the attributes DataFrame.
Well '4_56' does not exist in the attributes DataFrame.
Well '64_59' does not exist in the attributes DataFrame.
Well 'DOE104_63' does not exist in the attributes DataFrame.
Well 'H3_71' does not exist in the attributes DataFrame.
Well 'H4_71' does not exist in the attributes DataFrame.
Well 'H5_71' does not exist in the attributes DataFrame.
Well 'H6_71' does not exist in the attributes DataFrame.
Well 'H7_71' does not exist in the attributes DataFrame.
Well 'MUSK1_00' does not exist in the attributes DataFrame.
Well 'MUSK1_62' does not exist in the attributes DataFrame.
Well 'N1_71' does not exist in the attributes DataFrame.
Well 'N10_71' does not exist in the attributes DataFrame.
Well 'N11_71' does not exist in the attributes DataFrame.
Well 'N2_71' does not exist in the attributes DataFrame.
Well 'N3_71' does not exist in the attributes DataFrame.
Well 'N8_71' does not exist in the attributes DataFrame.
Well 'N9_71' does not exist in the attributes DataFrame.
('cell',) are not coordinates with an index xarray dataset must include 'cell' key (KeyError) or xarray 'cell' has no index (ValueError).
Initialize the reader for the collar data. Specify the file path, header, and column mappings.
reader_collar: GenericReaderFilesHelper = GenericReaderFilesHelper(
    file_or_buffer=os.getenv("PATH_TO_SPREMBERG_COLLAR"),
    header=0,
    usecols=[0, 1, 2, 4],
    columns_map={
            "hole_id"            : "id",
            "X_GK5_incl_inserted": "x",
            "Y__incl_inserted"   : "y",
            "Z_GK"               : "z"
    }
)

# Read the collar data into a DataFrame and create a Collars object.
df_collar = read_collar(reader_collar)
collar = Collars.from_df(df_collar)
/home/leguark/subsurface/subsurface/modules/reader/wells/_read_to_df.py:13: ParserWarning: Falling back to the 'python' engine because the 'c' engine does not support sep=None with delim_whitespace=False; you can avoid this warning by specifying engine='python'.
  d = reader(
Combine the collar and survey data into a BoreholeSet.
borehole_set = BoreholeSet(
    collars=collar,
    survey=survey,
    merge_option=MergeOptions.INTERSECT
)
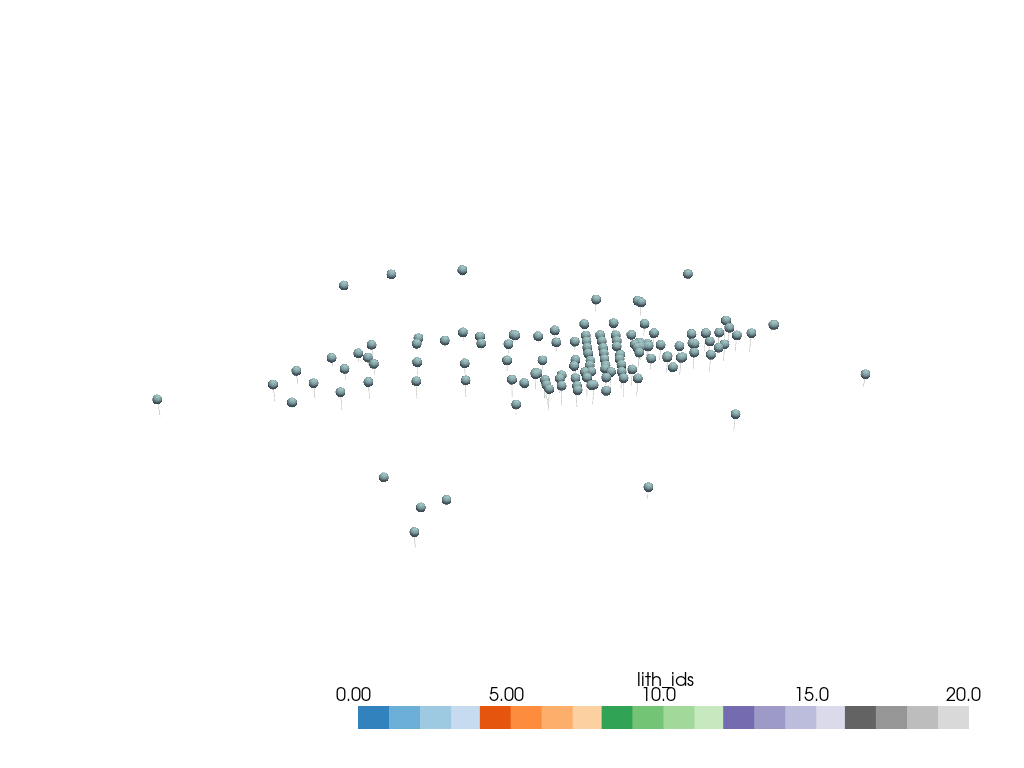
Visualize the borehole trajectories and collars using PyVista.
well_mesh = to_pyvista_line(
    line_set=borehole_set.combined_trajectory,
    active_scalar="lith_ids",
    radius=10
)

collars = to_pyvista_points(borehole_set.collars.collar_loc)

# Initialize the PyVista plotter.
pyvista_plotter = init_plotter()

# Define the units limit for thresholding the well mesh.
units_limit = [0, 20]

# Add the well mesh and collars to the plotter and display.
pyvista_plotter.add_mesh(
    well_mesh.threshold(units_limit),
    cmap="tab20c",
    clim=units_limit
)

pyvista_plotter.add_mesh(
    collars,
    point_size=10,
    render_points_as_spheres=True
)

pyvista_plotter.show()
Create structural elements from the borehole set for different lithological units.
elements: list[gp.data.StructuralElement] = gp.structural_elements_from_borehole_set(
    borehole_set=borehole_set,
    elements_dict={
            "Buntsandstein"       : {
                    "id"   : 53_300,
                    "color": "#983999"
            },
            "Werra-Anhydrit"      : {
                    "id"   : 61_730,
                    "color": "#00923f"
            },
            "Kupfershiefer"       : {
                    "id"   : 61_760,
                    "color": "#da251d"
            },
            "Zechsteinkonglomerat": {
                    "id"   : 61_770,
                    "color": "#f8c300"
            },
            "Rotliegend"          : {
                    "id"   : 62_000,
                    "color": "#bb825b"
            }
    }
)
Group the structural elements into a StructuralGroup and create a StructuralFrame.
group = gp.data.StructuralGroup(
    name="Stratigraphic Pile",
    elements=elements,
    structural_relation=gp.data.StackRelationType.ERODE
)
structural_frame = gp.data.StructuralFrame(
    structural_groups=[group],
    color_gen=gp.data.ColorsGenerator()
)
Determine the extent of the geological model from the surface points coordinates.
all_surface_points_coords: gp.data.SurfacePointsTable = structural_frame.surface_points_copy
extent_from_data = all_surface_points_coords.xyz.min(axis=0), all_surface_points_coords.xyz.max(axis=0)
Create a GeoModel with the specified extent, grid resolution, and interpolation options.
geo_model = gp.data.GeoModel(
    name="Stratigraphic Pile",
    structural_frame=structural_frame,
    grid=gp.data.Grid(
        extent=[extent_from_data[0][0], extent_from_data[1][0], extent_from_data[0][1], extent_from_data[1][1], extent_from_data[0][2], extent_from_data[1][2]],
        resolution=(50, 50, 50)
    ),
    interpolation_options=gp.data.InterpolationOptions(
        range=5,
        c_o=10,
        mesh_extraction=True,
        number_octree_levels=3,
    ),
)
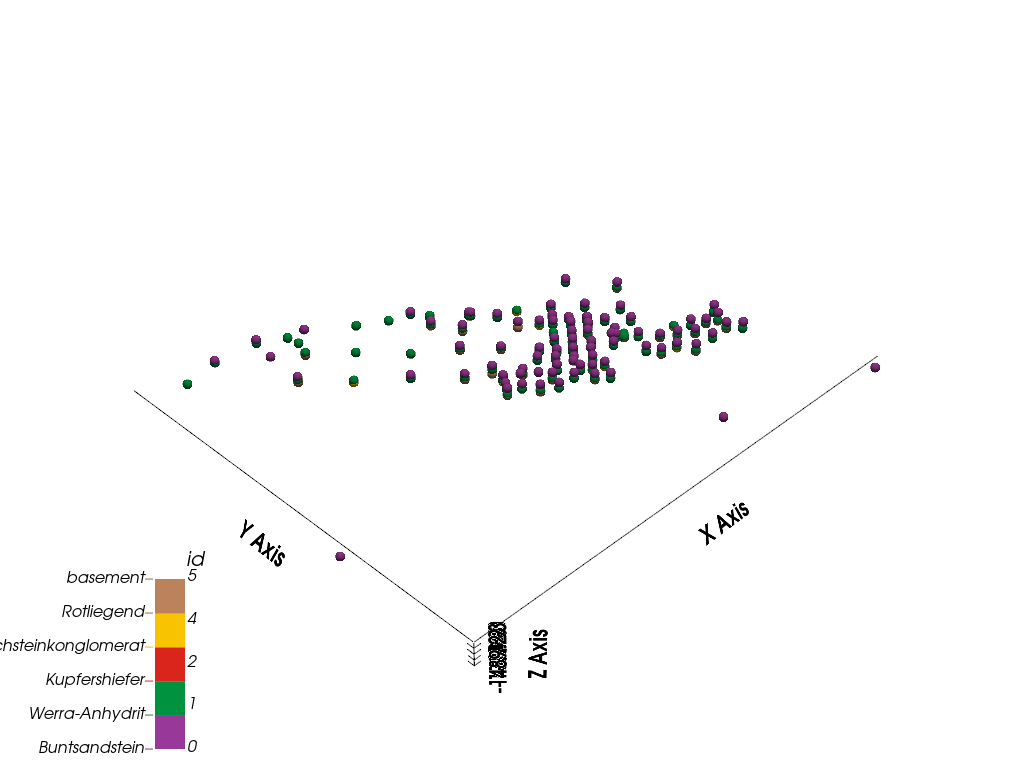
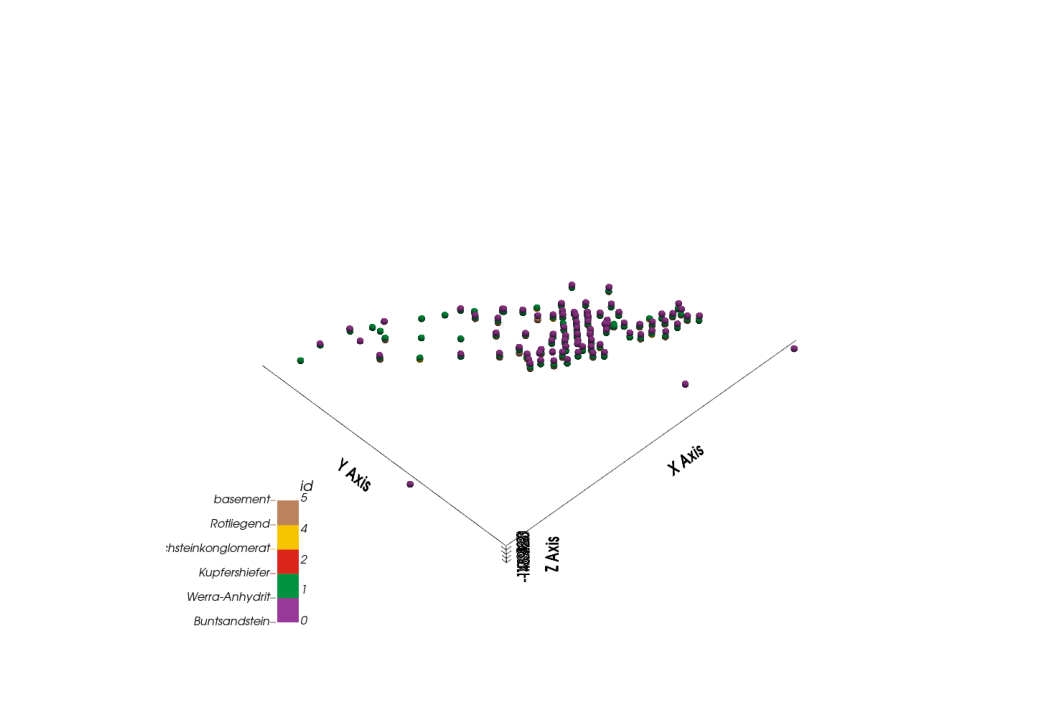
Visualize the 3D geological model using GemPy’s plot_3d function.
gempy_plot = gpv.plot_3d(
    model=geo_model,
    kwargs_pyvista_bounds={
            'show_xlabels': False,
            'show_ylabels': False,
    },
    show=True,
    image=True
)
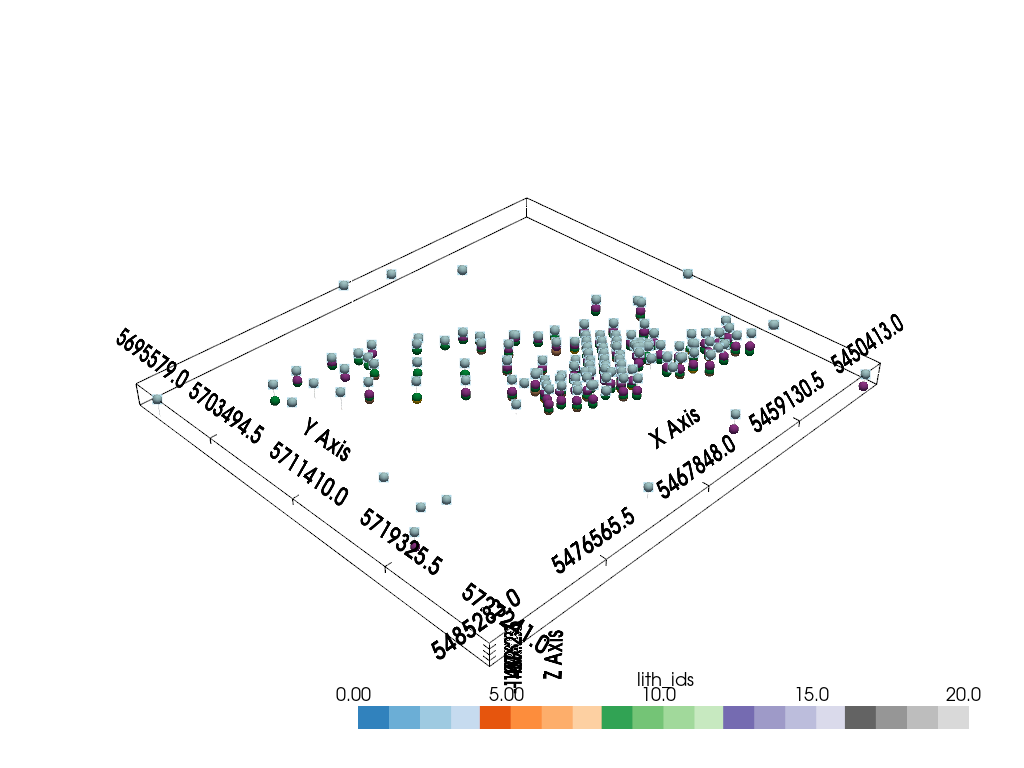
Combine all visual elements and display them together.
sp_mesh: pyvista.PolyData = gempy_plot.surface_points_mesh

pyvista_plotter = init_plotter()
pyvista_plotter.show_bounds(all_edges=True)

pyvista_plotter.add_mesh(
    well_mesh.threshold(units_limit),
    cmap="tab20c",
    clim=units_limit
)

pyvista_plotter.add_mesh(
    collars,
    point_size=10,
    render_points_as_spheres=True
)

pyvista_plotter.add_point_labels(
    points=collar.collar_loc.points,
    labels=collar.ids,
    point_size=10,
    shape_opacity=0.5,
    font_size=12,
    bold=True
)
pyvista_plotter.add_actor(gempy_plot.surface_points_actor)

pyvista_plotter.show()
Total running time of the script: (0 minutes 1.881 seconds)