Note
Go to the end to download the full example code
Model 1 Forward Gravity
This script demonstrates the calculation of forward gravity for model 1. It utilizes libraries such as GemPy, NumPy, and others to handle and process geophysical data.
import os
import time
import numpy as np
import pandas as pd
import xarray as xr
from matplotlib import pyplot as plt
from dotenv import dotenv_values
import gempy as gp
import gempy_viewer as gpv
from gempy_engine.core.backend_tensor import BackendTensor
from vector_geology.bayesian_helpers import calculate_scale_shift
from vector_geology.model_1_builder import initialize_geo_model
from vector_geology.omf_to_gempy import process_file
from vector_geology.utils import extend_box
Start the timer to measure the execution time of the script
start_time = time.time()
Load environment configuration This step reads configurations from a .env file, crucial for setting up file paths.
config = dotenv_values()
path = config.get("PATH_TO_MODEL_1_Subsurface")
Initialize structural elements for the geological model These will be used to build the model using GemPy.
structural_elements = []
global_extent = None
color_gen = gp.data.ColorsGenerator()
Process .nc files for geological model construction This loop reads and processes each .nc file to extract necessary data for the model.
for filename in os.listdir(path):
    base, ext = os.path.splitext(filename)
    if ext == '.nc':
        file_path = os.path.join(path, filename)
        structural_element, global_extent = process_file(file_path, global_extent, color_gen)
        structural_elements.append(structural_element)
Setup GemPy geological model Here, the model is initialized with the processed data.
geo_model = initialize_geo_model(
    structural_elements=structural_elements,
    extent=(np.array(global_extent)),
    topography=(xr.open_dataset(os.path.join(path, "Topography.nc"))),
    load_nuggets=True
)
/home/leguark/gempy/gempy/core/data/structural_frame.py:188: UserWarning: The basement color was already used in the structural elements.Changing the basement color to #015482.
  warnings.warn(f"The basement color was already used in the structural elements."
Active grids: GridTypes.NONE|TOPOGRAPHY|DENSE
Display the initialized GemPy model It’s always good practice to verify the model’s initialization.
print(geo_model)
{'_interpolation_options': InterpolationOptions(kernel_options={'range': 5, 'c_o': 10, 'uni_degree': 1, 'i_res': 4, 'gi_res': 2, 'number_dimensions': 3, 'kernel_function': <AvailableKernelFunctions.cubic: KernelFunction(base_function=<function cubic_function at 0x7f2f106c13f0>, derivative_div_r=<function cubic_function_p_div_r at 0x7f2f106c1480>, second_derivative=<function cubic_function_a at 0x7f2f106c1510>, consume_sq_distance=False)>, 'kernel_solver': <Solvers.DEFAULT: 1>, 'compute_condition_number': False, 'optimizing_condition_number': False, 'condition_number': None}, evaluation_options={'_number_octree_levels': 5, '_number_octree_levels_surface': 4, 'curvature_threshold': -1, 'error_threshold': 1.5, 'min_octree_level': 2, 'mesh_extraction': True, 'mesh_extraction_masking_options': <MeshExtractionMaskingOptions.INTERSECT: 3>, 'mesh_extraction_fancy': True, 'evaluation_chunk_size': 5000000, 'compute_scalar_gradient': False, 'verbose': False}, temp_interpolation_values=<gempy_engine.core.data.options.temp_interpolation_values.TempInterpolationValues object at 0x7f2ea8ec1270>, debug=True, cache_mode=CacheMode.IN_MEMORY_CACHE, cache_model_name=, block_solutions_type=BlockSolutionType.OCTREE, sigmoid_slope=50000, debug_water_tight=False),
 'grid': Grid(_octree_grid=None,
              _dense_grid=RegularGrid(resolution=array([20, 10, 20]),
                                      extent=array([ 5.59902830e+05,  5.64955682e+05,  6.44278260e+05,  6.50608735e+05,
       -1.75340000e+03,  1.60326604e+02]),
                                      values=array([[ 5.60029151e+05,  6.44594784e+05, -1.70555683e+03],
       [ 5.60029151e+05,  6.44594784e+05, -1.60987050e+03],
       [ 5.60029151e+05,  6.44594784e+05, -1.51418417e+03],
       ...,
       [ 5.64829361e+05,  6.50292212e+05, -7.88892213e+01],
       [ 5.64829361e+05,  6.50292212e+05,  1.67971089e+01],
       [ 5.64829361e+05,  6.50292212e+05,  1.12483439e+02]]),
                                      mask_topo=array([], shape=(0, 3), dtype=bool),
                                      _transform=None),
              _custom_grid=None,
              _topography=<gempy.core.data.grid_modules.topography.Topography object at 0x7f2ea8ec3130>,
              _sections=None,
              _centered_grid=None,
              values=array([[ 5.60029151e+05,  6.44594784e+05, -1.70555683e+03],
       [ 5.60029151e+05,  6.44594784e+05, -1.60987050e+03],
       [ 5.60029151e+05,  6.44594784e+05, -1.51418417e+03],
       ...,
       [ 5.64955682e+05,  6.49201963e+05,  1.06993262e+02],
       [ 5.64955682e+05,  6.49905349e+05,  8.89864414e+01],
       [ 5.64955682e+05,  6.50608735e+05,  7.05702308e+01]]),
              length=array([], dtype=float64),
              _transform=None,
              _octree_levels=-1),
 'input_transform': {'_cached_pivot': None,
 '_is_default_transform': False,
 'position': array([-562422.65655014, -647329.31794742,     823.58712106]),
 'rotation': array([0., 0., 0.]),
 'scale': array([8.55363115e-05, 8.55363115e-05, 8.55363115e-05])},
 'meta': GeoModelMeta(name='Tutorial_ch1_1_Basics',
                      creation_date=None,
                      last_modification_date=None,
                      owner=None),
 'structural_frame': StructuralFrame(
        structural_groups=[
StructuralGroup(
        name=Blue,
        structural_relation=StackRelationType.ERODE,
        elements=[
Element(
        name=HBL,
        color=#ffbe00,
        is_active=True
),
Element(
        name=KKR,
        color=#A46283,
        is_active=True
)
]
),
StructuralGroup(
        name=Red,
        structural_relation=StackRelationType.ERODE,
        elements=[
Element(
        name=ABL,
        color=#1D3943,
        is_active=True
),
Element(
        name=LGR,
        color=#6394A4,
        is_active=True
),
Element(
        name=WAL,
        color=#72A473,
        is_active=True
)
]
)
],
        fault_relations=
[[False, False],
 [False, False]],
}
Read Bouguer gravity data from a CSV file This data is used for geophysical calculations later in the script.
df = pd.read_csv(
    filepath_or_buffer=config.get("PATH_TO_MODEL_1_BOUGUER"),
    sep=',',
    header=0
)
Filter and prepare the gravity data for further processing This step ensures we use the relevant subset of the data.
df = df[df['X'] < 565000]
interesting_columns = df[['X', 'Y', 'Bouguer_267_complete']]
Set up interpolation options for the GemPy model Configuring interpolation is crucial for accurate geological modeling.
interpolation_options = geo_model.interpolation_options
interpolation_options.mesh_extraction = True
interpolation_options.kernel_options.range = .7
interpolation_options.kernel_options.c_o = 3
interpolation_options.kernel_options.compute_condition_number = True
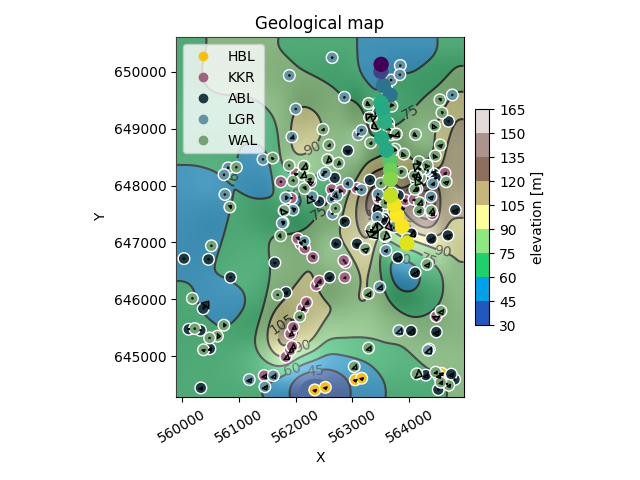
Plot the 2D representation of the geological model with gravity data This visualization helps in understanding the spatial distribution of the data.
plot2d = gpv.plot_2d(geo_model, show_topography=True, section_names=["topography"], show=False)
plot2d.axes[0].scatter(
    interesting_columns['X'],
    interesting_columns['Y'],
    c=interesting_columns['Bouguer_267_complete'],
    cmap='viridis',
    s=100,
    zorder=10000
)
plot2d.fig.show()
Calculate and display the script execution time so far Monitoring execution time is useful for performance optimization.
end_time = time.time()
execution_time = end_time - start_time
print(f"The function executed in {execution_time} seconds.")
The function executed in 2.5401320457458496 seconds.
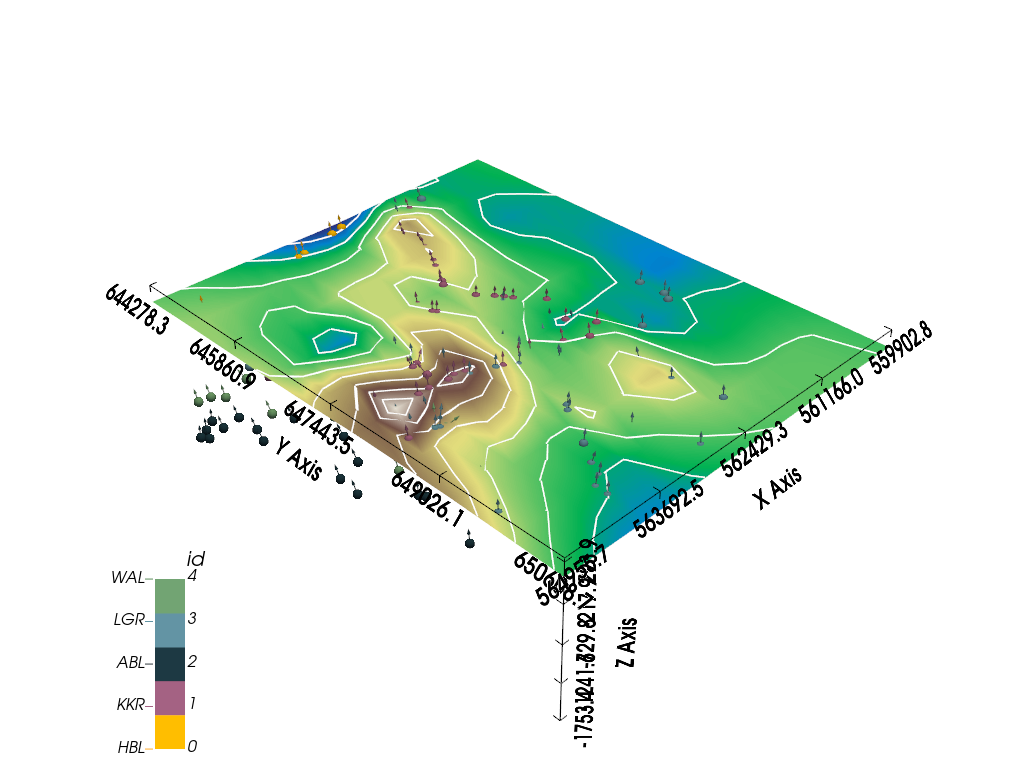
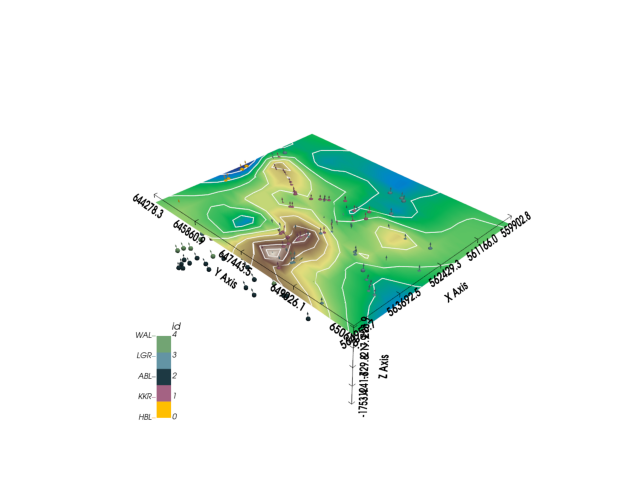
3D visualization of the geological model This 3D view provides a comprehensive perspective of the model’s structure.
gempy_vista = gpv.plot_3d(
    model=geo_model,
    show=True,
    kwargs_plot_structured_grid={'opacity': 0.8},
    image=True
)
Prepare and set up data for geophysical calculations Configuring the data correctly is key for accurate gravity calculations.
device_location = interesting_columns[['X', 'Y']]
device_location['Z'] = 0  # Add a Z-coordinate
Set up a centered grid for geophysical calculations This grid will be used for gravity gradient calculations.
gp.set_centered_grid(
    grid=geo_model.grid,
    centers=device_location,
    resolution=np.array([10, 10, 15]),
    radius=np.array([5000, 5000, 5000])
)
Active grids: GridTypes.NONE|CENTERED|TOPOGRAPHY|DENSE

CenteredGrid(centers=array([[563661.087, 648441.046,      0.   ],
       [563669.585, 648272.032,      0.   ],
       [563669.949, 648109.941,      0.   ],
       [563957.93 , 646986.009,      0.   ],
       [563872.578, 647286.382,      0.   ],
       [563782.33 , 647474.644,      0.   ],
       [563735.776, 647663.405,      0.   ],
       [563669.181, 647826.937,      0.   ],
       [563661.916, 649593.721,      0.   ],
       [563543.392, 649761.449,      0.   ],
       [563500.952, 650008.198,      0.   ],
       [563504.273, 650133.658,      0.   ],
       [563497.948, 649457.15 ,      0.   ],
       [563534.516, 649329.217,      0.   ],
       [563568.834, 649122.263,      0.   ],
       [563597.443, 648625.232,      0.   ],
       [563512.081, 648836.925,      0.   ]]), resolution=array([10, 10, 15]), radius=array([5000, 5000, 5000]), kernel_grid_centers=array([[-5000.        , -5000.        ,  -300.        ],
       [-5000.        , -5000.        ,  -360.        ],
       [-5000.        , -5000.        ,  -383.36972966],
       ...,
       [ 5000.        ,  5000.        , -3407.68480754],
       [ 5000.        ,  5000.        , -4618.11403801],
       [ 5000.        ,  5000.        , -6300.        ]]), left_voxel_edges=array([[1709.43058496, 1709.43058496,  -30.        ],
       [1709.43058496, 1709.43058496,  -30.        ],
       [1709.43058496, 1709.43058496,  -11.68486483],
       ...,
       [1709.43058496, 1709.43058496, -435.56428767],
       [1709.43058496, 1709.43058496, -605.21461523],
       [1709.43058496, 1709.43058496, -840.942981  ]]), right_voxel_edges=array([[1709.43058496, 1709.43058496,  -30.        ],
       [1709.43058496, 1709.43058496,  -11.68486483],
       [1709.43058496, 1709.43058496,  -16.23606704],
       ...,
       [1709.43058496, 1709.43058496, -605.21461523],
       [1709.43058496, 1709.43058496, -840.942981  ],
       [1709.43058496, 1709.43058496, -840.942981  ]]))
Change backend for GemPy to support tensor operations This is necessary for integrating GemPy with PyTorch.
BackendTensor.change_backend_gempy(engine_backend=gp.data.AvailableBackends.PYTORCH, dtype="float64")
Setting Backend To: AvailableBackends.PYTORCH
Calculate the gravity gradient using GemPy Gravity gradient data is critical for geophysical modeling and inversion.
gravity_gradient = gp.calculate_gravity_gradient(geo_model.grid.centered_grid)
Define and set up densities tensor for the gravity calculation Densities are a fundamental part of the gravity modeling process.
densities_tensor = BackendTensor.t.array([2.61, 2.92, 3.1, 2.92, 2.61, 2.61])
densities_tensor.requires_grad = True
Set geophysics input for the GemPy model Configuring this input is crucial for the forward gravity calculation.
geo_model.geophysics_input = gp.data.GeophysicsInput(
    tz=BackendTensor.t.array(gravity_gradient),
    densities=densities_tensor
)
Compute the geological model with geophysical data This computation integrates the geological model with gravity data.
sol = gp.compute_model(
    gempy_model=geo_model,
    engine_config=gp.data.GemPyEngineConfig(
        backend=gp.data.AvailableBackends.PYTORCH,
        dtype='float64'
    )
)
grav = - sol.gravity
grav[0].backward()
Setting Backend To: AvailableBackends.PYTORCH
Chunking done: 6 chunks
Output gradient information for analysis The gradient data can provide insights into the density distribution.
print(densities_tensor.grad)
tensor([7.8962e-03, 1.9249e-01, 1.1455e+00, 9.8152e-01, 1.3207e+01, 1.5280e+02])
Perform scale and shift calculations on the gravity data These calculations align the model’s gravity data with observed values.
s, c = calculate_scale_shift(
    a=interesting_columns["Bouguer_267_complete"].values,
    b=(grav.detach().numpy())
)
Display the calculated scale and shift values Understanding these values is important for interpreting the results.
print("Scale (s):", s)
print("Shift (c):", c)
Scale (s): 0.6781754018106533
Shift (c): 436.951602077492
Adapt the gravity data based on scale and shift calculations This step adjusts the model’s gravity data to match observed values.
adapted_grav = s * interesting_columns["Bouguer_267_complete"] + c
diff = adapted_grav - grav.detach().numpy()
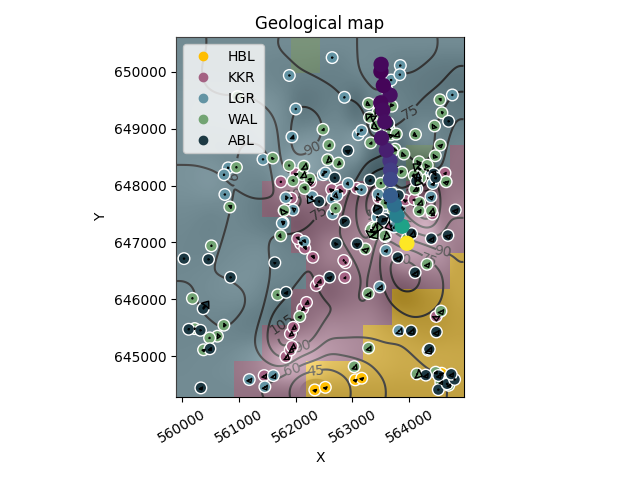
Visualization of adapted gravity data This visualization helps in comparing the model’s gravity data with observations.
plot2d = gpv.plot_2d(geo_model, show_topography=True, section_names=["topography"], show=False)
plot2d.axes[0].scatter(
    interesting_columns['X'],
    interesting_columns['Y'],
    c=grav.detach().numpy(),
    cmap='viridis',
    s=100,
    zorder=10000
)
plt.show()
/home/leguark/gempy_viewer/gempy_viewer/API/_plot_2d_sections_api.py:105: UserWarning: Section contacts not implemented yet. We need to pass scalar field for the sections grid
  warnings.warn(
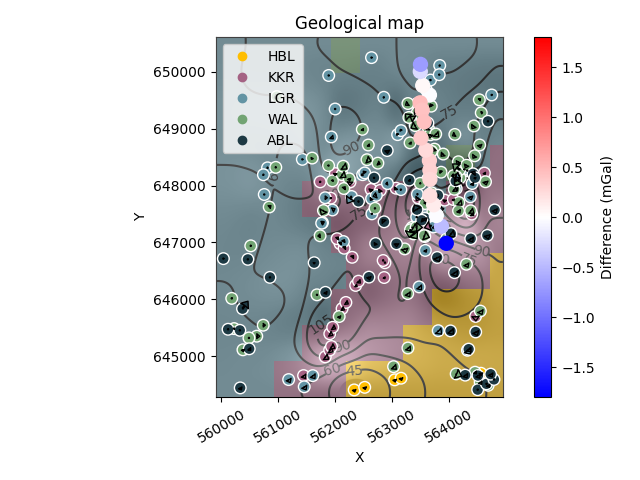
Calculate symmetric vmin and vmax for the colorbar in the difference plot This step ensures a balanced color representation of positive and negative differences.
max_diff = np.max(np.abs(diff))  # Get the maximum absolute value from diff
vmin, vmax = -max_diff, max_diff  # Set vmin and vmax
Plotting the difference between adapted and computed gravity data This plot highlights the discrepancies between the model and observed data.
plot2d = gpv.plot_2d(geo_model, show_topography=True, section_names=["topography"], show=False)
sc = plot2d.axes[0].scatter(
    interesting_columns['X'],
    interesting_columns['Y'],
    c=diff,
    cmap='bwr',
    s=100,
    zorder=10000,
    vmin=vmin,
    vmax=vmax
)
plt.colorbar(sc, label="Difference (mGal)")
plt.show()

# sphinx_gallery_thumbnail_number = -1
/home/leguark/gempy_viewer/gempy_viewer/API/_plot_2d_sections_api.py:105: UserWarning: Section contacts not implemented yet. We need to pass scalar field for the sections grid
  warnings.warn(
Total running time of the script: (0 minutes 18.998 seconds)